[Case 04]
Dashboard Redesigns
Transforming complex operational data into clear, actionable insights through a scalable dashboard experience.
Dashboard Redesigns
A scalable dashboard system designed to bring clarity to complex operational data.
[Project Overview]
The OCC dashboards transformed complex operational data into clear, accessible insights for teams across the organization. The goal was to create a centralized dashboard experience that made it easier for users to understand performance, identify trends, and make informed decisions without relying on manual reporting or fragmented data sources.
[The Challenge]
Operational data was difficult to interpret and often required users to navigate multiple sources to understand performance. Existing reporting processes made it challenging to quickly identify trends, compare information, and surface the insights that mattered most.
The opportunity was to create a dashboard experience that simplified complex information while giving users the flexibility to explore the data relevant to their role.
[Role]
Product Designer
[Focus]
UX/UI Design
Data Visualization
Information Architecture
Goals & Outcomes
Primary Goal
[Goals]
Simplified Complex Data → Transformed large amounts of operational information into clear, digestible dashboard views that prioritized the most important insights.
Created a Scalable Dashboard System → Established reusable layouts, components, and patterns that could support multiple dashboard experiences and future reporting needs.
Improved Information Hierarchy → Structured content around user priorities, making key metrics, trends, and performance indicators easier to scan and understand.
Designed for Different User Needs → Balanced high-level summaries with deeper data views so users could quickly understand performance while still having access to supporting details.
[Process]
[01] Research
Reviewed existing reporting experiences and identified where users experienced friction when accessing and interpreting operational information.
Explored the types of information users needed most frequently and how different roles interacted with performance data.
Translated research findings into design priorities focused on clarity, discoverability, efficiency, and scalability.
[02] Ideation & Exploration
Developed different approaches for organizing dashboard content, comparing ways to surface key metrics without overwhelming users.
Explored different layouts, data visualizations, hierarchy systems, and interaction patterns to determine the clearest approach.
Refined concepts around the most valuable user needs, balancing quick-glance insights with opportunities to explore the underlying data.
[03] Design Process
Created a consistent structure for dashboard pages, establishing clear relationships between summaries, metrics, charts, and supporting information.
Developed repeatable UI components and visualization patterns to create consistency across the dashboard ecosystem.
Focused on visual hierarchy and interaction design to make complex operational information easier to understand and act upon.
[04] Testing & Iteration
Shared designs with stakeholders to validate the overall structure, content hierarchy, and usefulness of proposed dashboard experiences.
Refined layouts, components, and information hierarchy based on feedback and evolving requirements.
Polished the final experience and ensured the dashboards were cohesive, usable, and ready to be implemented and launched.
[Impact]
The OCC dashboards provided a more centralized and accessible way for teams to engage with operational data. By bringing key information into a structured dashboard experience, the product reduced the complexity of navigating reporting information and created a stronger foundation for data-driven decision making.
Most importantly, the dashboards moved from concept to launched product, giving teams a scalable experience that could continue to evolve alongside their reporting needs.
[Reflection]
This project strengthened my ability to design for complex information systems where the challenge isn't simply presenting data, but determining what users need to see, when they need to see it, and how that information can support better decisions.
It also reinforced the importance of balancing user needs with technical and business constraints while creating a system that can scale beyond a single dashboard or use case.
[Case 06]
Event Booking
Transforming student experiences into measurable, career-ready competencies
Event Booking
Designing a system that bridges academic learning and real-world experience.
[Project Overview]
A digital platform that enables students to document, reflect on, and validate their experiences, transforming them into structured, shareable competencies.
Traditional transcripts capture grades.
This system captures capability.
[Problem Statement]
Students graduate with a wide range of valuable experiences, internships, volunteer work, leadership roles, but struggle to clearly communicate what they’ve learned from them.
Traditional transcripts:
Emphasize grades over skills
Lack real-world context
Fail to capture competencies like leadership, collaboration and problem-solving
As a result, students are underrepresented in the job market and employers lack meaningful insight into their capabilities.
[Role]
UX/UI Designer
[Focus]
Product Thinking
Systems Design
Student Experience
Goals & Outcomes
Primary Goal
Create a structured system that translates student experiences into clear, credible and career-ready competencies.
[Goals]
Clarify Student Value → Enable students to confidently articulate what they’ve learned from their experiences.
Increase Skill Visibility → Make competencies more accessible and understandable beyond traditional transcripts.
Establish Credibility → Introduce validation to ensure experiences are trusted and meaningful.
Design a Scalable System → Build a framework that can adapt across programs and institutions.
[Outcomes]
Improved Self-Expression for Students → Students can confidently translate experiences into structured skills.
Stronger Employer Understanding → Employers gain clearer insight into candidate capabilities beyond grades.
Increased Reflection & Engagement → Students become more intentional about documenting and reflecting on experiences.
Bridged Academic and Real-World Learning → Experiential learning becomes more integrated into formal education systems
[Process]
[01] Research
Students lacked a centralized way to track and reflect on experiences.
Non-academic work was often undervalued or disconnected from career paths.
Traditional resumes failed to capture depth, reflection and transferable skills.
[02] Ideation & Exploration
Explored multiple ways to input, manage and showcase experiences.
Tested layout directions including timeline and card-based structures.
Selected a card-based approach to improve scannability for students and employers.
[03] Design Process
Designed a system balancing structure and flexibility for documenting experiences.
Built card-based views and expandable details with competencies and reflection.
Enabled guided inputs and sharing controls to support engagement and visibility.
[04] Testing & Iteration
Identified friction from unnecessary clicks and inefficient flows.
Streamlined interactions and optimized dashboard density for better usability.
Iterated on layout to improve clarity, flexibility, and overall experience.
[Final Solution]
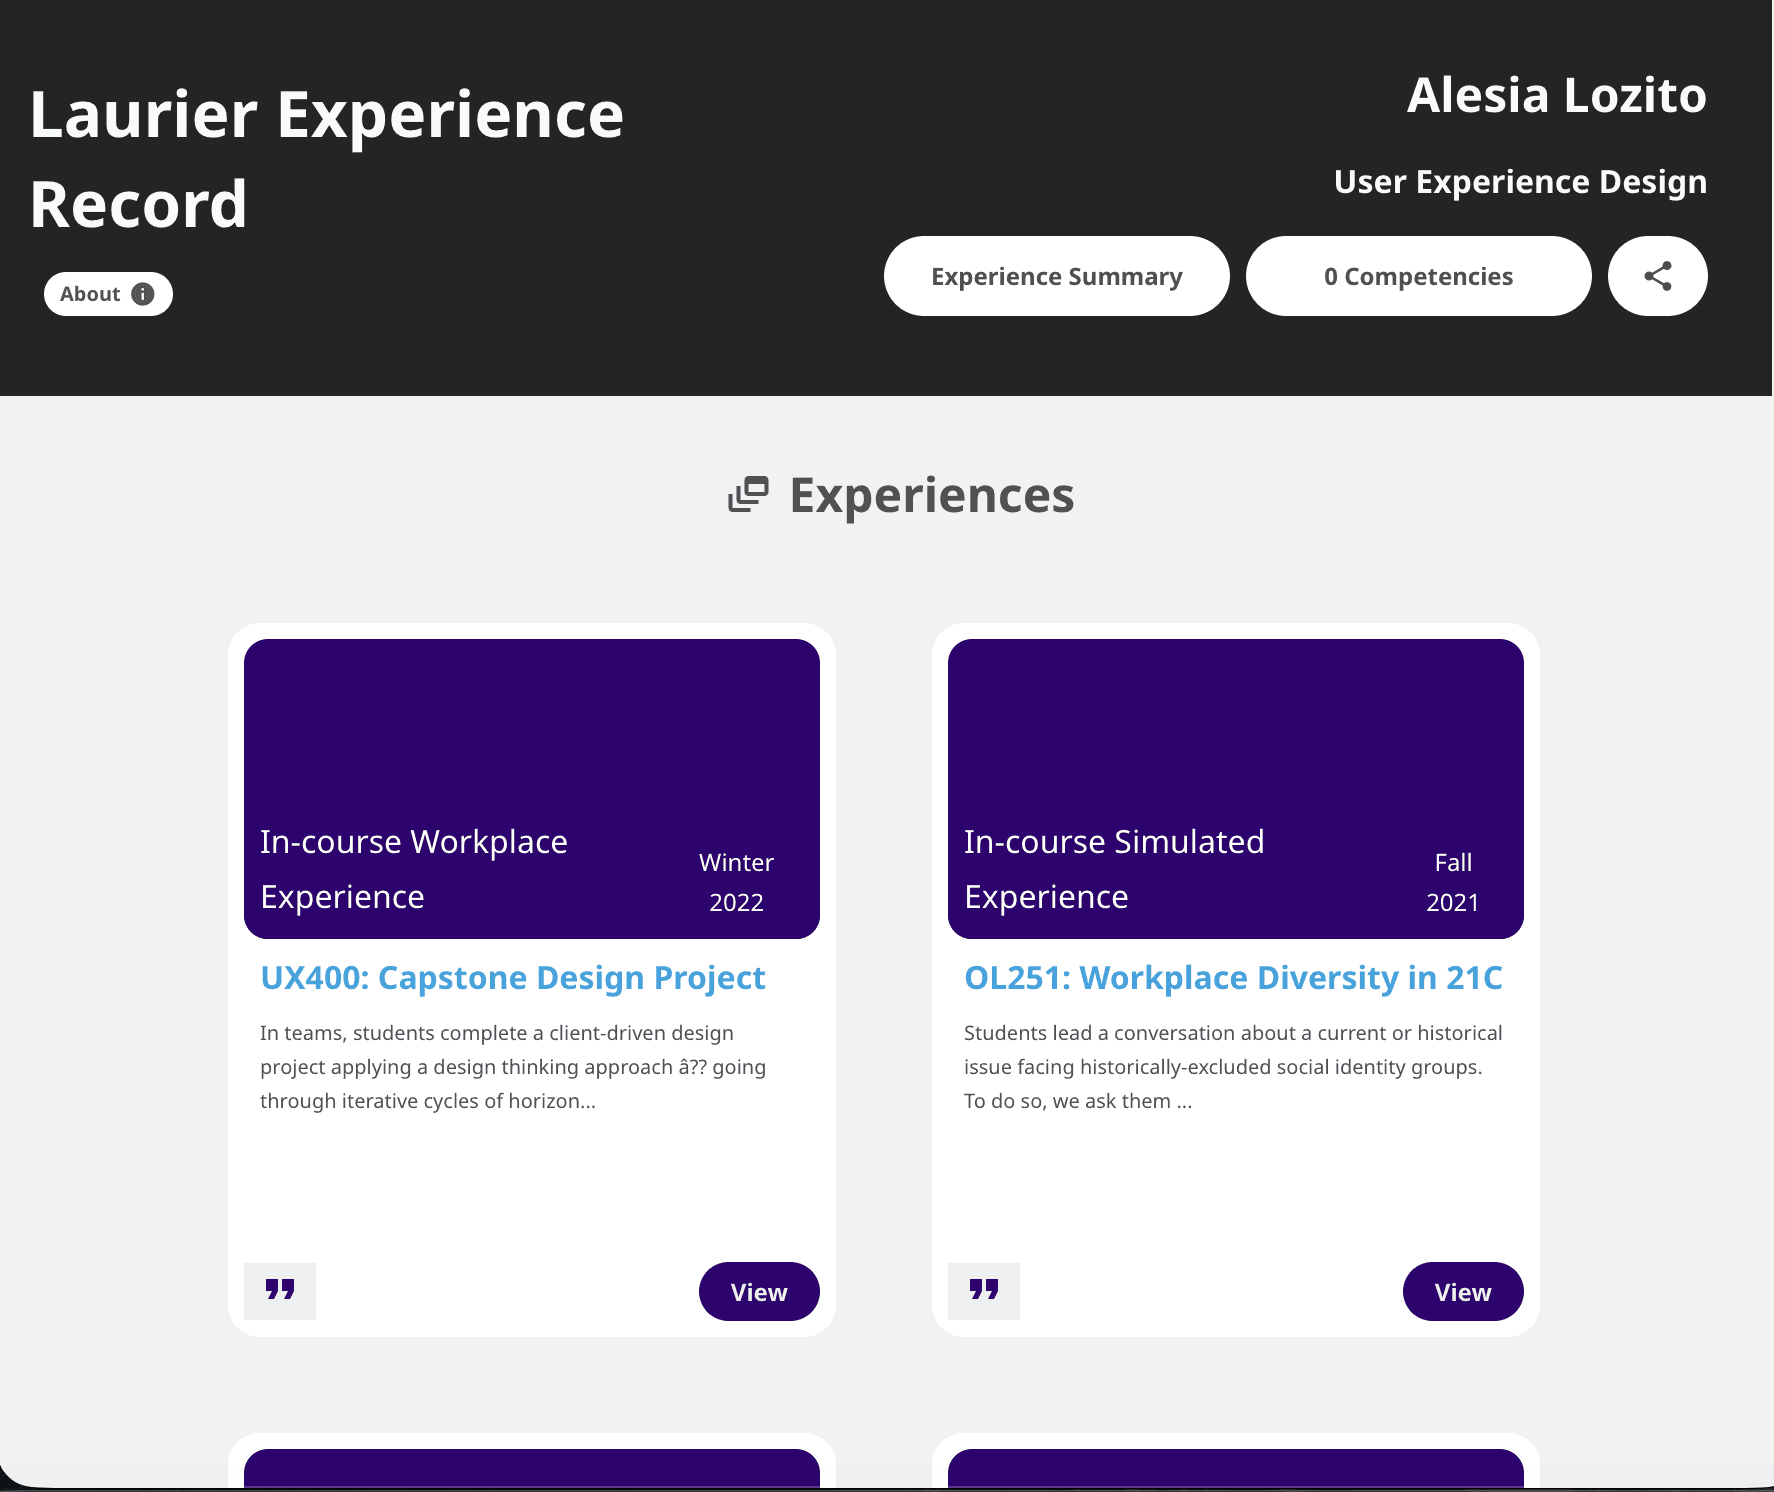
Centralized platform for capturing, reflecting on, and showcasing student experiences.
Student-controlled visibility and competency-based storytelling beyond traditional resumes.
Scannable, professional interface adopted across post-secondary institutions in North America.
[Impact]
Widespread Adoption
Implemented at multiple universities and colleges across North America.
Enhanced Student Engagement
Guided reflection and public visibility encourage students to actively document experiences
Improved Skill Communication
Students are better able to articulate transferable skills and growth to potential employers
Streamlined Usability
Dashboard improvements reduced friction in logging and managing experiences, improving efficiency
Employer Benefit
The card-based, professional presentation allows employers to quickly understand student competencies and relevant experiences.
[Reflection]
This project emphasized designing beyond individual screens and into systems and communication.
Key Takeaways
Clarity is structural, not just visual
Strong UX helps users express what they already know
Systems thinking is essential for complex, information-heavy problems
Designing this experience reinforced the importance of creating tools that don’t just store information but translate it into meaningful understanding.
[Case 06]
Event Booking
Transforming student experiences into measurable, career-ready competencies
Goals & Outcomes
Primary Goal
Create a structured system that translates student experiences into clear, credible and career-ready competencies.
[Goals]
Clarify Student Value → Enable students to confidently articulate what they’ve learned from their experiences.
Increase Skill Visibility → Make competencies more accessible and understandable beyond traditional transcripts.
Establish Credibility → Introduce validation to ensure experiences are trusted and meaningful.
Design a Scalable System → Build a framework that can adapt across programs and institutions.
[Outcomes]
Improved Self-Expression for Students → Students can confidently translate experiences into structured skills.
Stronger Employer Understanding → Employers gain clearer insight into candidate capabilities beyond grades.
Increased Reflection & Engagement → Students become more intentional about documenting and reflecting on experiences.
Bridged Academic and Real-World Learning → Experiential learning becomes more integrated into formal education systems
[Process]
[01] Research
Students lacked a centralized way to track and reflect on experiences.
Non-academic work was often undervalued or disconnected from career paths.
Traditional resumes failed to capture depth, reflection and transferable skills.
[02] Ideation & Exploration
Explored multiple ways to input, manage and showcase experiences.
Tested layout directions including timeline and card-based structures.
Selected a card-based approach to improve scannability for students and employers.
[03] Design Process
Designed a system balancing structure and flexibility for documenting experiences.
Built card-based views and expandable details with competencies and reflection.
Enabled guided inputs and sharing controls to support engagement and visibility.
[04] Testing & Iteration
Identified friction from unnecessary clicks and inefficient flows.
Streamlined interactions and optimized dashboard density for better usability.
Iterated on layout to improve clarity, flexibility, and overall experience.
[Final Solution]
Centralized platform for capturing, reflecting on, and showcasing student experiences.
Student-controlled visibility and competency-based storytelling beyond traditional resumes.
Scannable, professional interface adopted across post-secondary institutions in North America.
[Impact]
Widespread Adoption
Implemented at multiple universities and colleges across North America.
Enhanced Student Engagement
Guided reflection and public visibility encourage students to actively document experiences
Improved Skill Communication
Students are better able to articulate transferable skills and growth to potential employers
Streamlined Usability
Dashboard improvements reduced friction in logging and managing experiences, improving efficiency
Employer Benefit
The card-based, professional presentation allows employers to quickly understand student competencies and relevant experiences.
[Reflection]
This project emphasized designing beyond individual screens and into systems and communication.
Key Takeaways
Clarity is structural, not just visual
Strong UX helps users express what they already know
Systems thinking is essential for complex, information-heavy problems
Designing this experience reinforced the importance of creating tools that don’t just store information but translate it into meaningful understanding.
Event Booking
Designing a system that bridges academic learning and real-world experience.
[Project Overview]
A digital platform that enables students to document, reflect on, and validate their experiences, transforming them into structured, shareable competencies.
Traditional transcripts capture grades.
This system captures capability.
[Problem Statement]
Students graduate with a wide range of valuable experiences, internships, volunteer work, leadership roles, but struggle to clearly communicate what they’ve learned from them.
Traditional transcripts:
Emphasize grades over skills
Lack real-world context
Fail to capture competencies like leadership, collaboration and problem-solving
As a result, students are underrepresented in the job market and employers lack meaningful insight into their capabilities.
[Role]
UX/UI Designer
[Focus]
Product Thinking
Systems Design
Student Experience